Enhancing data solutions for better performance outcomes via FSCS internal Data Tool
The Background (Context)
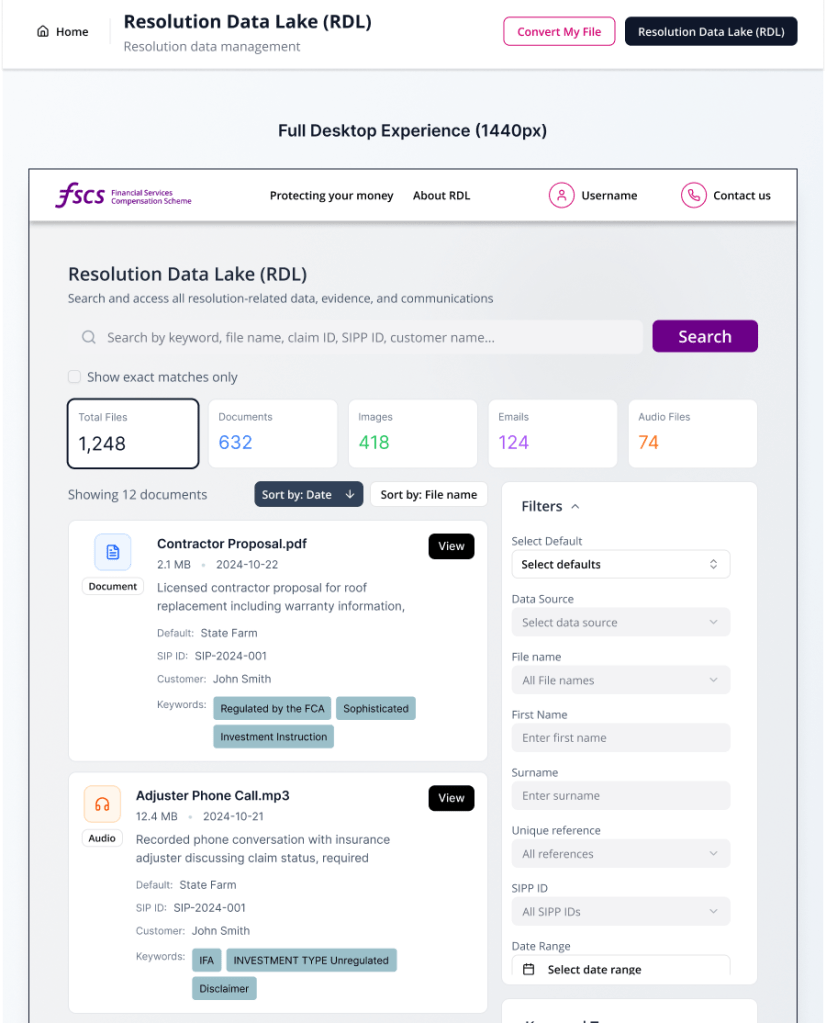
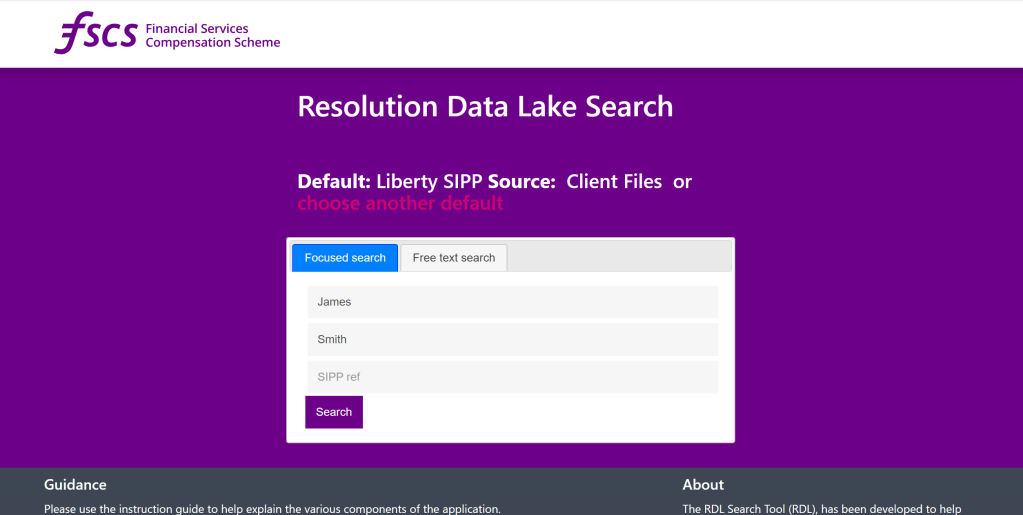
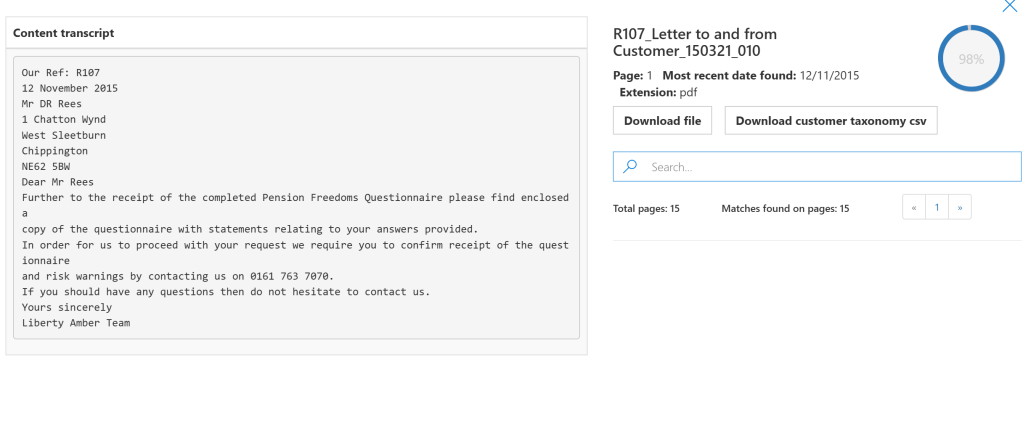
An internal document search tool that allows members of FSCS to efficiently look for client, customer and third-party information within data files such as word documents, images and pdf. All documents must be searchable therefore pdfs and images must be extracted using Optical Character Recognition (OCR) technology.
The data tool use cases are:
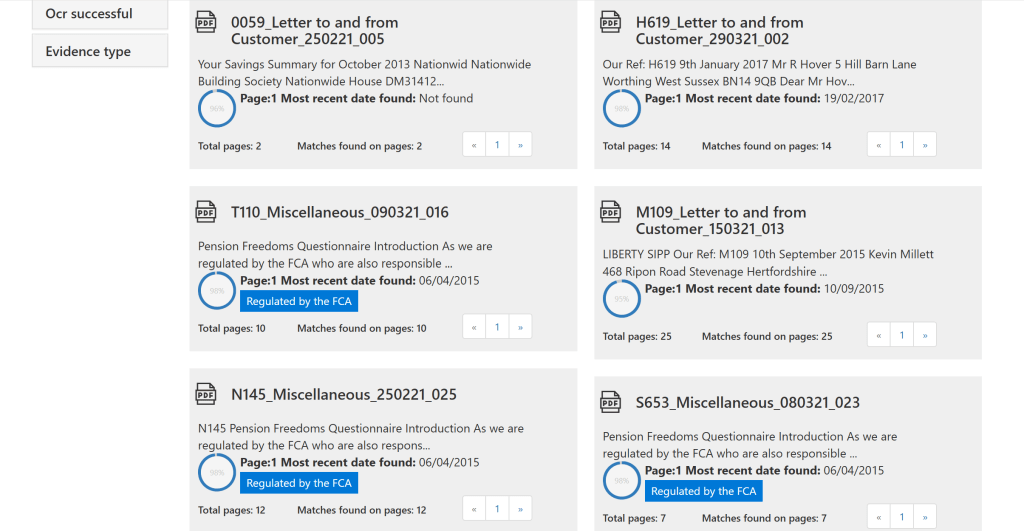
Finding specific claim information
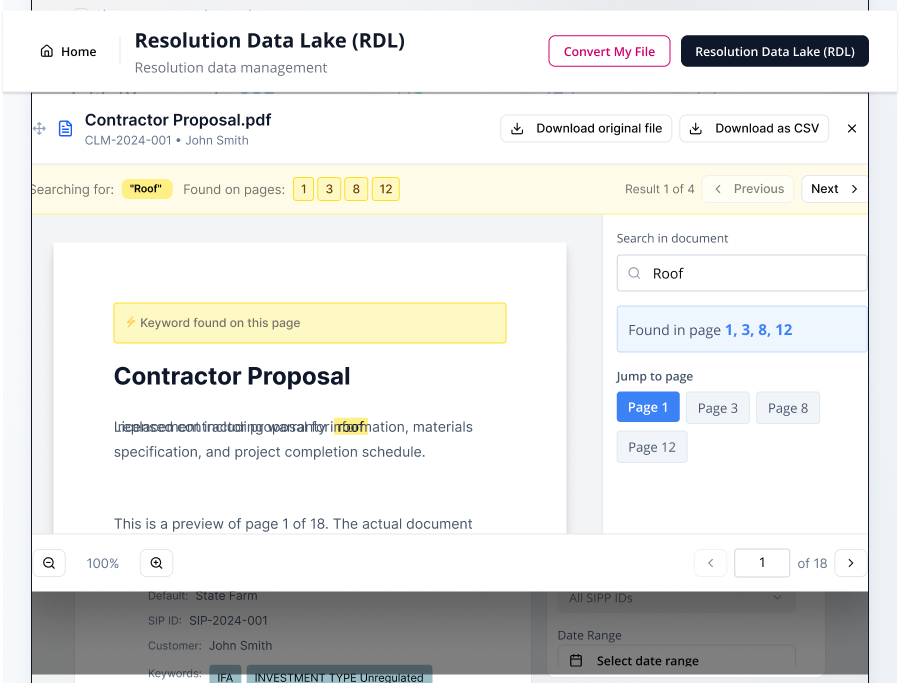
Locating key documents in large files
Investigating introducer details
Differences:
One team uses: Primary tool for document access and claim review
Another team: Used more selectively (e.g. introducer insights, targeted queries)
The Objective
Improving Adoption
Recommendations focus on making S27 Dashboard easier to use, valuable, and aligned with actual user workflows.
Pragmatic Incremental Changes
Focus on incremental improvements complementing RDL Web, reducing complexity, and supporting multiple user roles.
Goals of Recommendations
Increase confidence, reduce frustration, and help users complete work efficiently through better usability and clarity.
The challenge
Key issue: Low adoption
Navigating life’s intricate fabric, choices unfold paths to the extKey problem: Adoption is low despite high awareness and access and the need for such tool.
Lacking key usability principles, the data tool struggles when it comes to the following;
Ease of Use
Focus on fixing usability issues and clarifying metrics to make the dashboard easy to navigate and understand.
Demonstrate Usefulness
Showcase time-saving value and reliable insights to prove the dashboard’s usefulness to users.
Learnability and Support
Provide practical, scenario-based training and ongoing support to help users learn to use the tool effectively.
Relevance to Workflows
Align the dashboard with real workflows, roles, and trusted systems to ensure relevance and increase adoption.raordinary, demanding creativity, curiosity, and courage for a truly fulfilling journey.
Research stages
Survey, usability sessions & interviews
To understand the low adoption levels, I conducted a structured research approach. I started with a survey targeting both current and potential users to establish a baseline understanding. This was followed by moderated usability sessions, where I observed how users carry out their day‑to‑day tasks and how the tool fits into their workflows. These sessions revealed gaps, opportunities, and previously unreported pain points. I concluded with in-depth interviews across different roles to better understand their needs, use cases, and to explore the challenges they face in more detail.
The research gave us clear reasons why the tool was failing, some reasons for not using the tool were:
Lack of training/onboarding
No time-saving benefit
No perceived value
Lack of training
Difficult to use / confusing
Role doesn’t require it (e.g. appeals, review-heavy roles)
New to team
Confusing to use
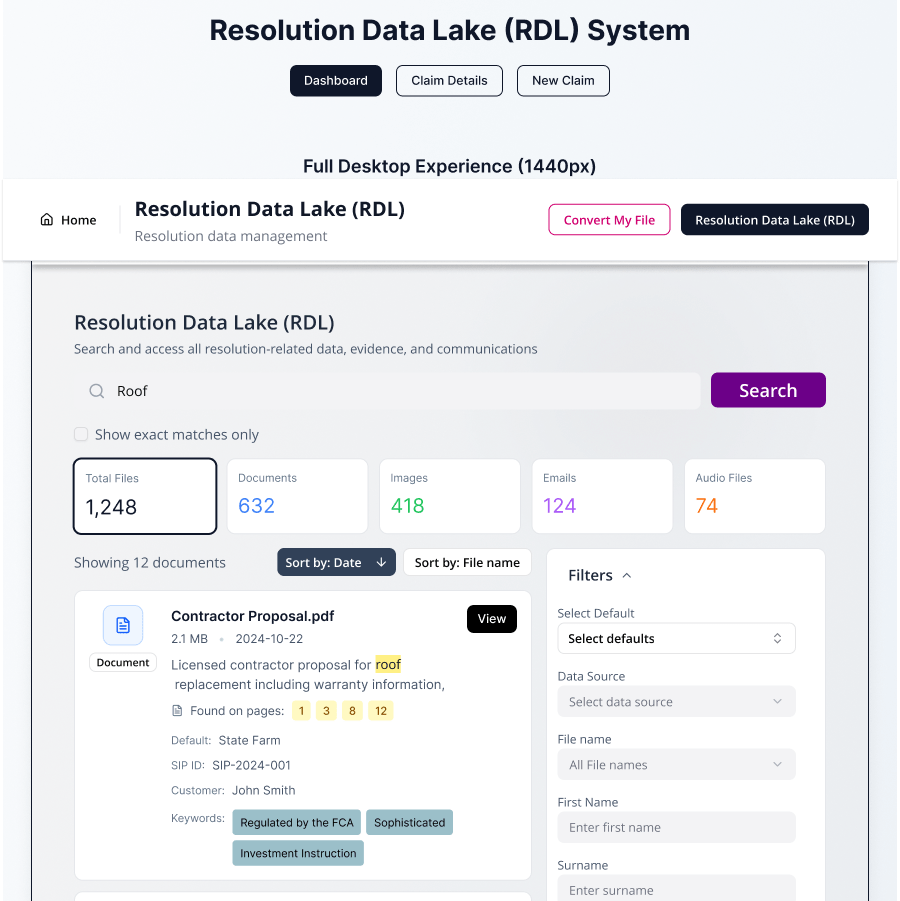
Difficult to search effectively
Unclear metrics (e.g. “match percentage”)
Doesn’t fit well with full-file review workflows
The outcome
Team: Myself, 1 Front-end Dev, Product Manager
With a support team we could call upon when required (infrastructure, back-end developers and testers), we created a new revamped tool that addresses the following;
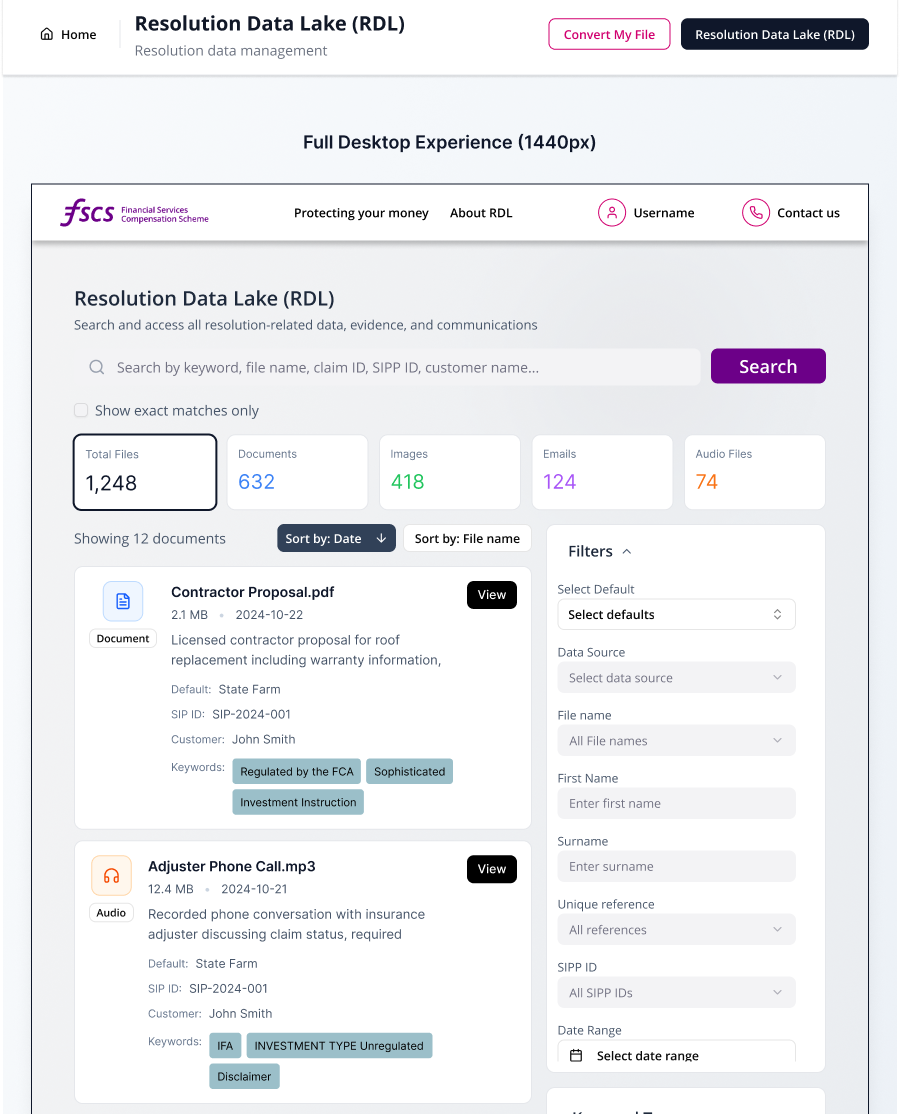
Simplify Interface Design
Reducing visual clutter and using clear, descriptive labels improve navigation and reduce user confusion.
Enhance Metric Explanation
Tooltips and plain language explanations clarify metrics like ‘match percentage’ to build user trust.
Prioritize Common Actions
Frequently used features such as search should be easily accessible, requiring minimal clicks.
Provide User Guidance
In-dashboard hints and walkthroughs assist first-time users to quickly understand and use the dashboard effectively.
Search Reliability Importance
Reliable search results are crucial to maintain user trust and confidence in the analytical dashboard.
Improving Search Logic
Auditing search logic and expanding filtering options helps return accurate and relevant results for various search terms.
Clear Feedback on No Results
The system should clearly explain no results found and provide suggestions or alternative search approaches.
Transparency and Communication
Transparent data coverage and limitations help users understand dashboard capabilities and build confidence.
The data tool redesigned